tre200h0 tre200hx sre000h0
2026-06-12 00:00:00     11.6     11.8        0
2026-06-12 01:00:00     11.8     12.3        0
2026-06-12 02:00:00     12.2     12.3        0
2026-06-12 03:00:00     11.0     11.5        0
2026-06-12 04:00:00     11.4     11.6        0
2026-06-12 05:00:00 10.9 11.4 0Stationdata
This article contains a series of examples on how to retrieve station observations for different data sets.
The data itself is served via a series of CSV Files which are downloaded, read, and prepared by ms_stationdata() for easy use. Important to know is that historic data is provided in CSV files covering 10 years. Even if only interested in a couple of days in a row, the entire file has to be downloaded which may take a while. This also means that processing large batches at a time is more efficient than processing year-by-year as the same large file will be downloaded/parsed over and over again.
A caching option (see here) is available which can help during development.
Hourly observations
1 station, 3 parameters
- Dataset: hourly measurements
- Three weeks in 2026 during the June heat wave
- Parameters: three parameters only
- Stations: single station, STG (St. Gallen)
plot(stgallen)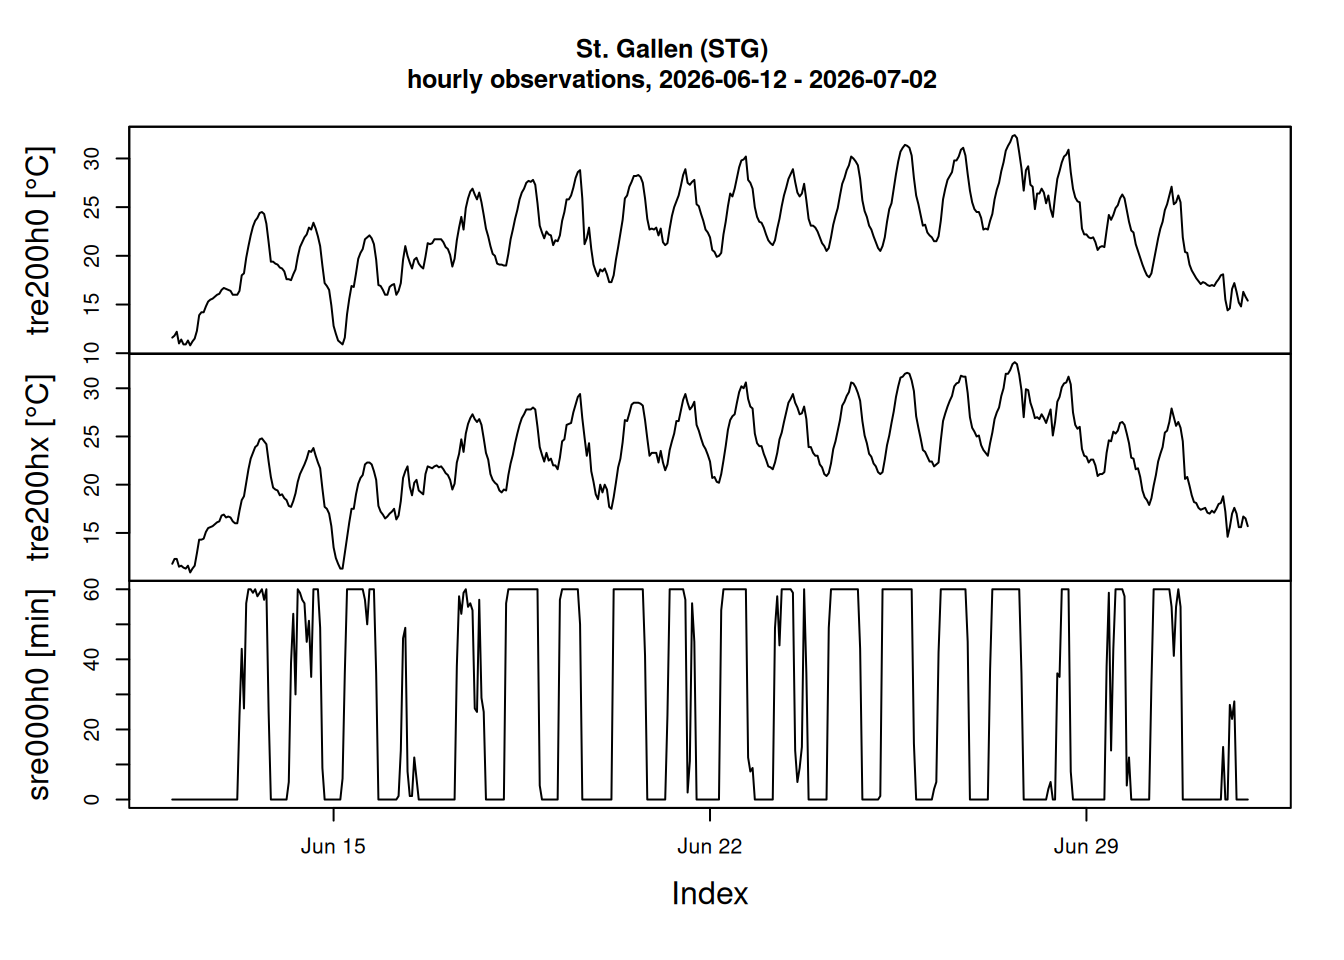
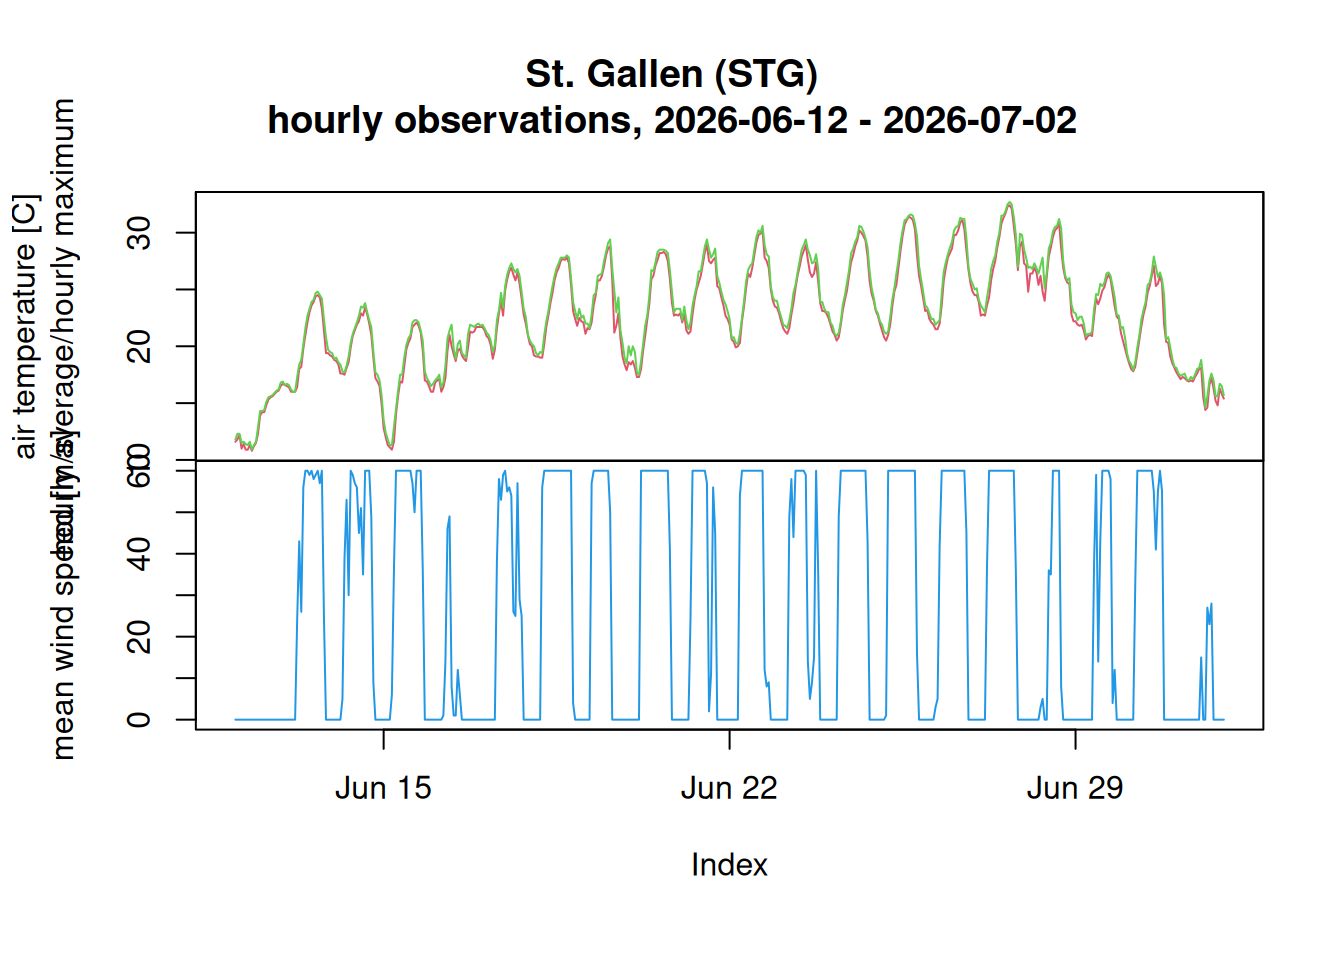
The object returned carries the station information as well as the parameter observations with it (attributes).
attr(stgallen, "parameters")# A tibble: 3 × 7
parameter_shortname parameter_description_en parameter_group_en
<chr> <chr> <chr>
1 sre000h0 Sunshine duration; hourly total Sunshine
2 tre200h0 Air temperature 2 m above ground; hour… Temperature
3 tre200hx Air temperature 2 m above ground; hour… Temperature
# ℹ 4 more variables: parameter_granularity <chr>, parameter_decimals <int>,
# parameter_datatype <chr>, parameter_unit <chr>List of 9
$ id : chr "stg"
$ collection : chr "ch.meteoschweiz.ogd-smn"
$ type : chr "Feature"
$ stac_version: chr "1.0.0"
$ datetime : POSIXct[1:1], format: "2026-07-09 04:00:33"
$ title : chr "St. Gallen (STG)"
$ created : POSIXct[1:1], format: "2025-03-28 10:01:25"
$ updated : POSIXct[1:1], format: "2026-07-09 21:29:56"
$ geometry :sfc_POINT of length 1; first list element: 'XY' num [1:2] 9.4 47.4daily records, multiple stations, all parameters
- Dataset: historical daily records
- One month at the beginning of 2026
- Parameters: all available parameters (uses
parameters = NULL; default) - Stations: three different stations
The function allows to retrieve data for multiple stations at once and to download all avialable parameters by not specifying parameters (uses parameters = NULL). This will return all avialable data for each of the stations in a named list, where the names of the elements correspond to the station id.
devtools::load_all("../")ℹ Loading msdata
TODO: msdata startup message with some information to geo.admin.ch and
how to cite the data if used, though that is tricky as it is
different for different data sets and must be found somewhere
on the data providers home page.
[1] "LUG" "ZER" "GVE"lapply(multiple, dim)$LUG
[1] 31 31
$ZER
[1] 31 30
$GVE
[1] 31 30Given processing multiple stations at once the return is a named list. The name of the element is the station identifier (station abbreviation), the content of each element is again an object of class c(“ms_stationdata”, “zoo”):
lapply(multiple, class)$LUG
[1] "ms_stationdata" "zoo"
$ZER
[1] "ms_stationdata" "zoo"
$GVE
[1] "ms_stationdata" "zoo" lapply(multiple, dim)$LUG
[1] 31 31
$ZER
[1] 31 30
$GVE
[1] 31 30head(multiple$ZER, n = 2) tre200d0 tre200dx tre200dn tre005d0 tre005dx tre005dn ure200d0
2026-01-01 2.9 5.8 -0.5 1.9 10.5 -2.9 73.2
2026-01-02 3.6 7.2 0.7 2.5 13.3 -1.5 71.9
pva200d0 prestad0 pp0qffd0 pp0qnhd0 fkl010d0 fkl010d1 fu3010d0
2026-01-01 5.5 979.7 1016.7 1015.5 1.2 5.3 4.3
2026-01-02 5.7 968.4 1004.8 1003.8 1.0 3.7 3.6
fu3010d1 fkl010d3 fu3010d3 wcc006d0 rre150d0 rka150d0 gre000d0
2026-01-01 19.1 5.3 19.1 0 0 0 63
2026-01-02 13.3 3.5 12.6 0 0 0 78
oli000d0 sre000d0 sremaxdv erefaod0 xcd000d0 dkl010d0 xno000d0
2026-01-01 268 255 63 0.3 0 297 17.1
2026-01-02 255 399 99 0.2 0 360 16.4
xno012d0 rreetsd0
2026-01-01 9.1 -0.2
2026-01-02 8.4 -0.3plot(multiple$ZER, nc = 3, col = "steelblue", type = "o", pch = 4)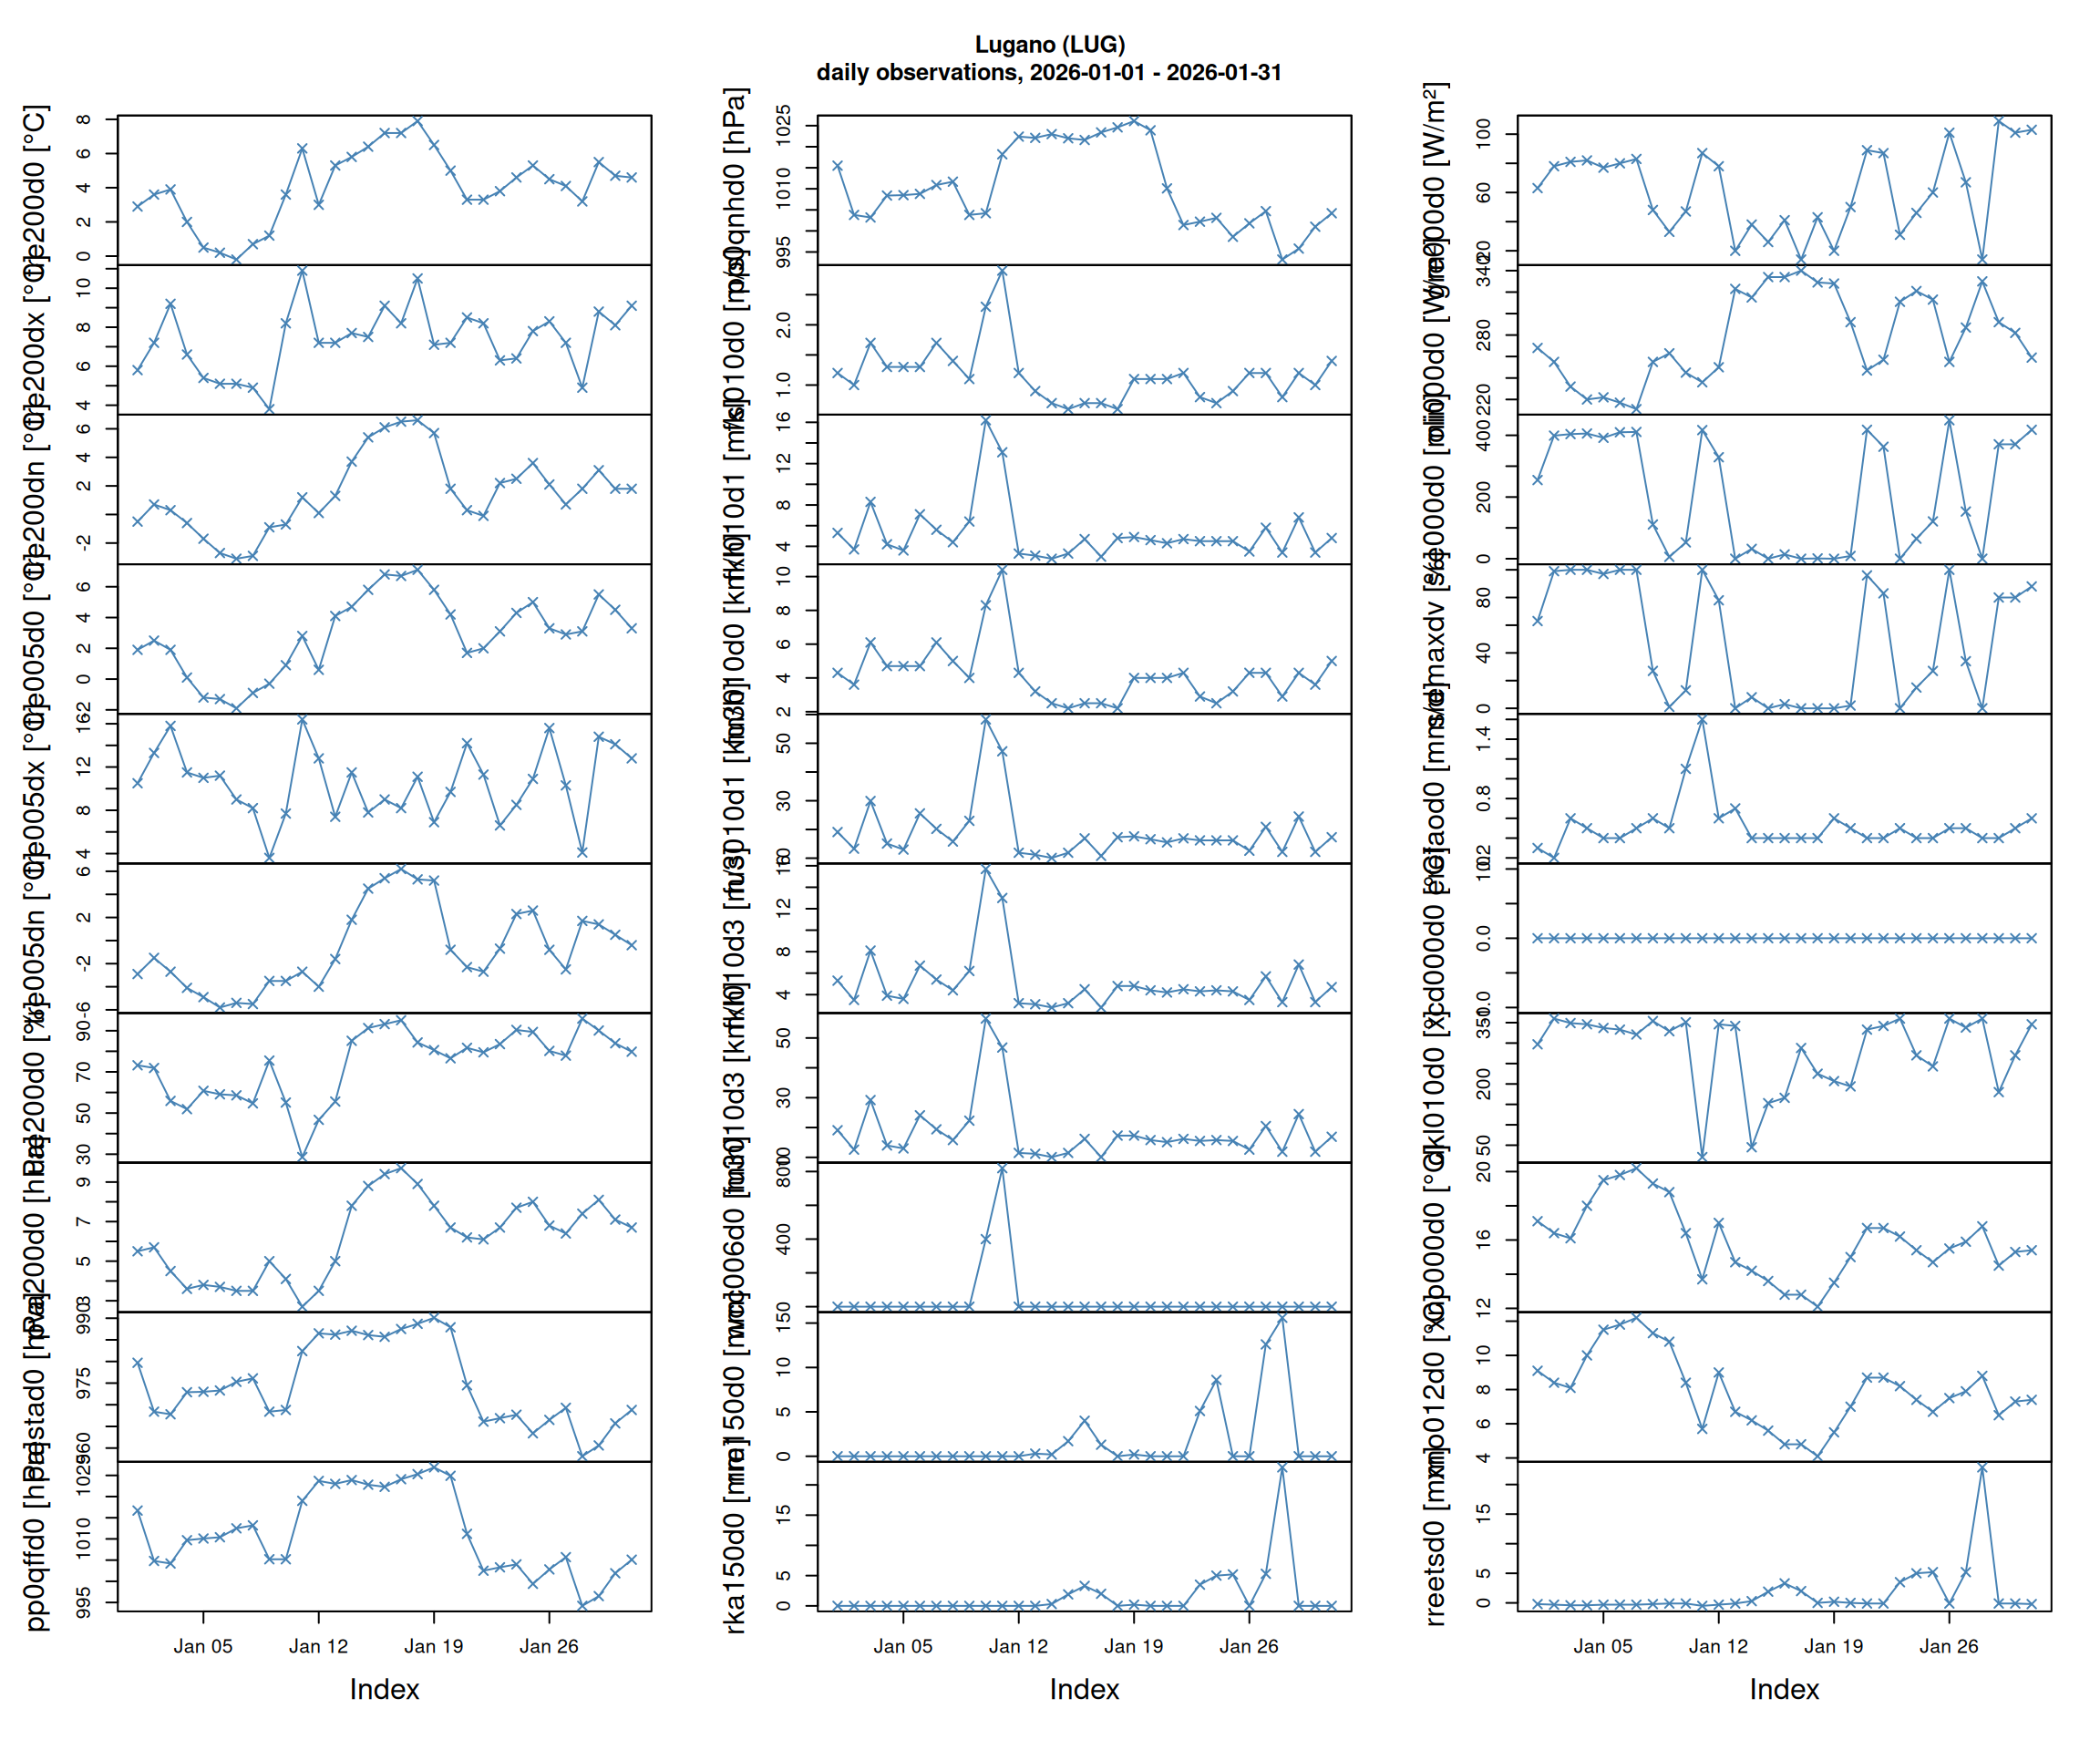
Precipitation data
In the same way data from the precipitation station collection can be processed.
meta <- ms_metadata("ch.meteoschweiz.ogd-smn-precip")
plot(meta)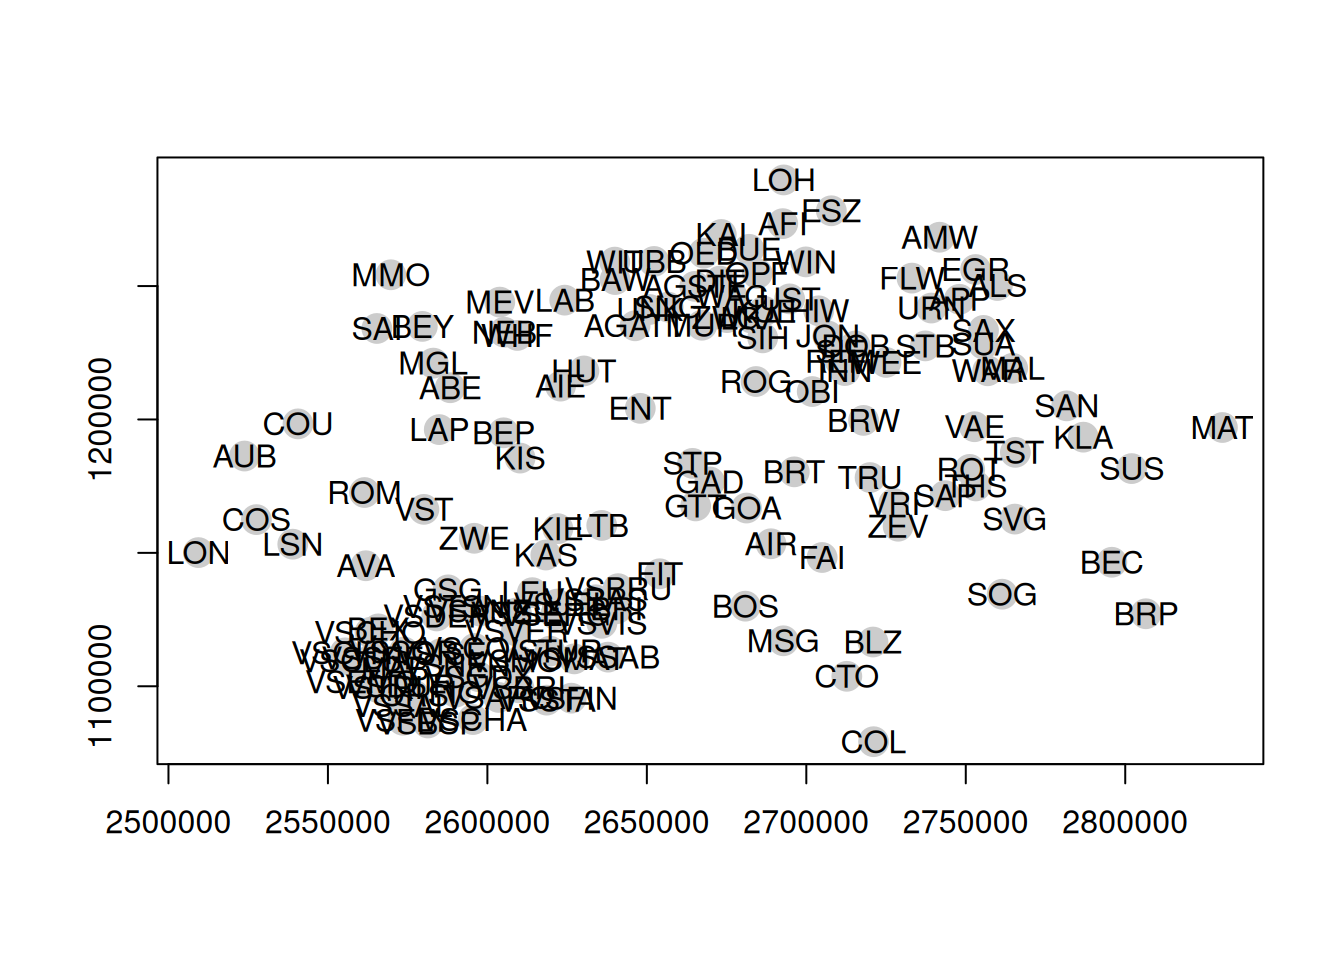
# Loading data for station Belp (BEP)
precip <- ms_stationdata(id         = "ch.meteoschweiz.ogd-smn-precip",
                         stations   = "BEP",
                         resolution = "h",
                         start      = "2026-01-01",
                         end        = "2026-01-31")

head(precip)
rre150h0
2026-01-01 00:00:00 0
2026-01-01 01:00:00 0
2026-01-01 02:00:00 0
2026-01-01 03:00:00 0
2026-01-01 04:00:00 0
2026-01-01 05:00:00 0attr(precip, "parameters")# A tibble: 1 × 7
parameter_shortname parameter_description_en parameter_group_en
<chr> <chr> <chr>
1 rre150h0 Precipitation; hourly total Precipitation
# ℹ 4 more variables: parameter_granularity <chr>, parameter_decimals <int>,
# parameter_datatype <chr>, parameter_unit <chr>plot(precip, col = "steelblue", lwd = 2)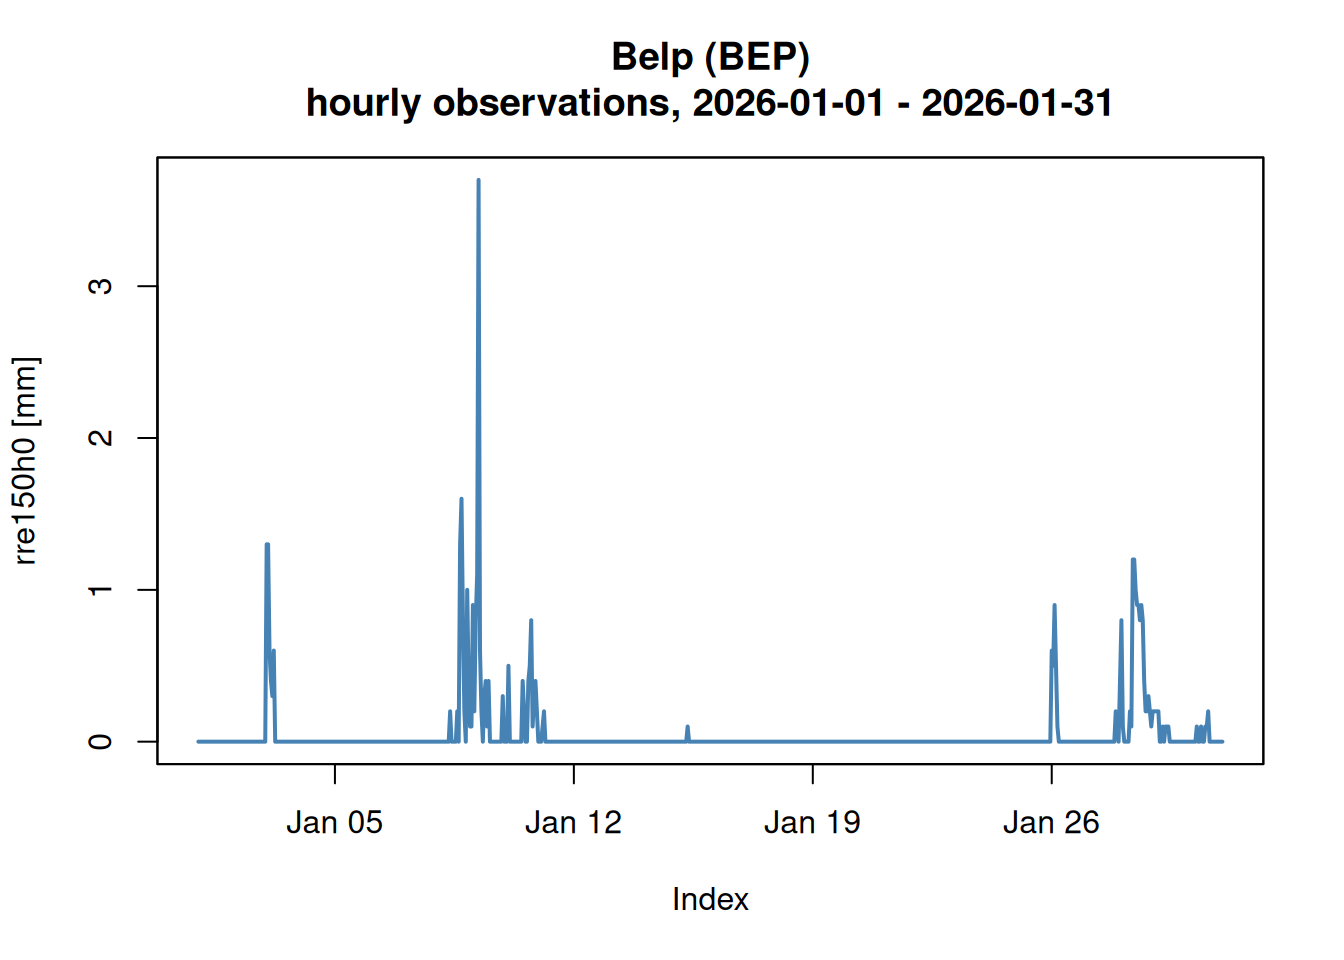
Tower data
In addition, a series of towers are available measuring some atmospheric properties.
meta <- ms_metadata("ch.meteoschweiz.ogd-smn-tower")
meta$stations[, c("station_abbr", "station_name")]
Simple feature collection with 4 features and 2 fields
Geometry type: POINT
Dimension: XY
Bounding box: xmin: 2606850 ymin: 1202975 xmax: 2679455 ymax: 1269037
Projected CRS: CH1903+ / LV95
# A tibble: 4 × 3
station_abbr station_name geometry
<chr> <chr> <POINT [m]>
1 BAN Bantiger (2606850 1202975)
2 PSI Würenlingen / PSI (2659356 1265381)
3 STC St. Chrischona (2618696 1269037)
4 UEB Uetliberg (2679455 1245034)plot(meta)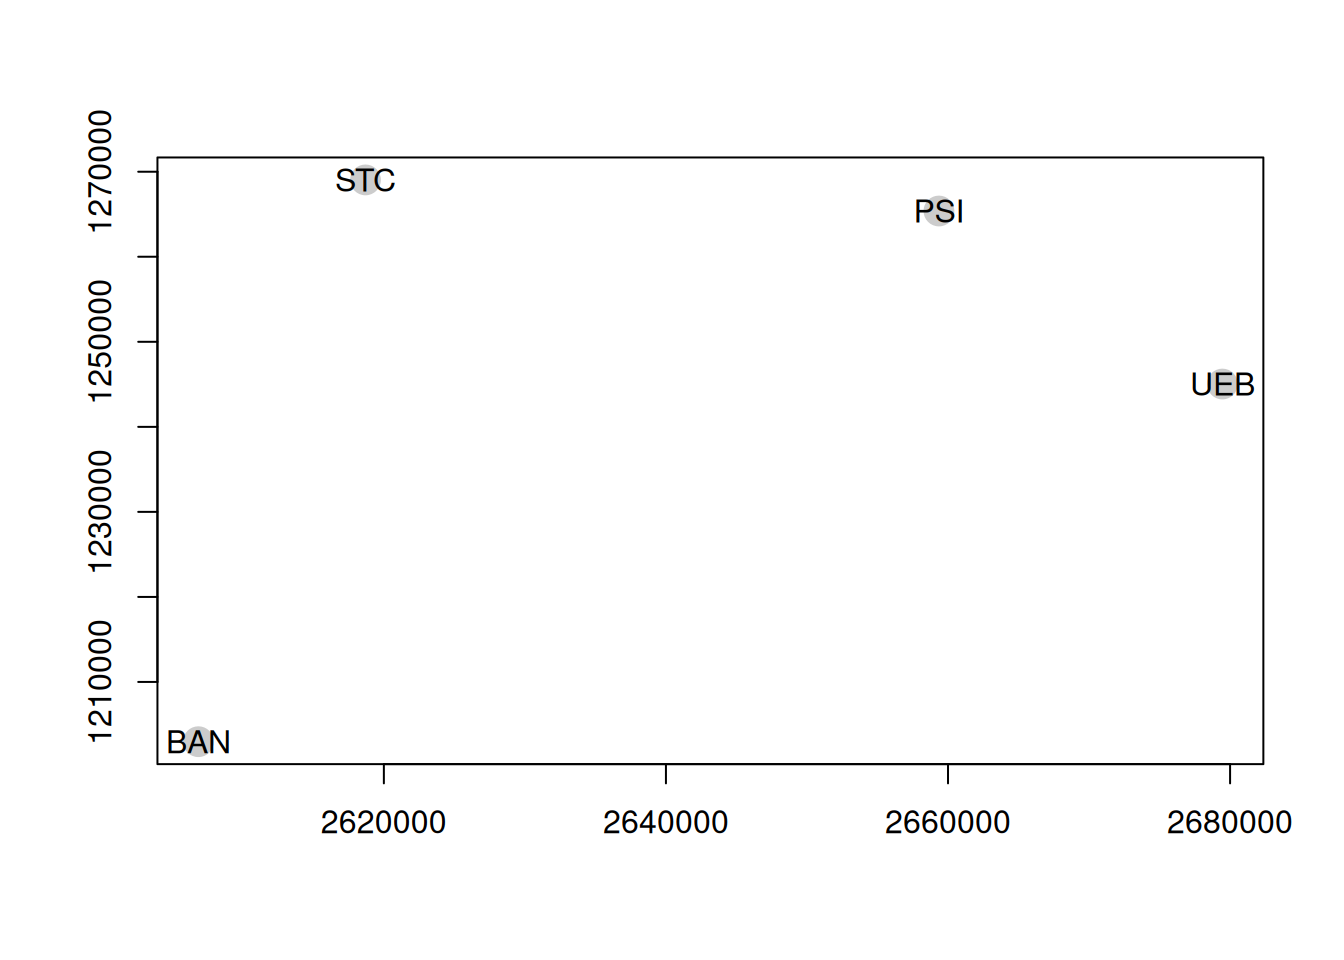
# Loading data for station Belp (BEP)
devtools::load_all("../")
ℹ Loading msdata
TODO: msdata startup message with some information to geo.admin.ch and
how to cite the data if used, though that is tricky as it is
different for different data sets and must be found somewhere
on the data providers home page.
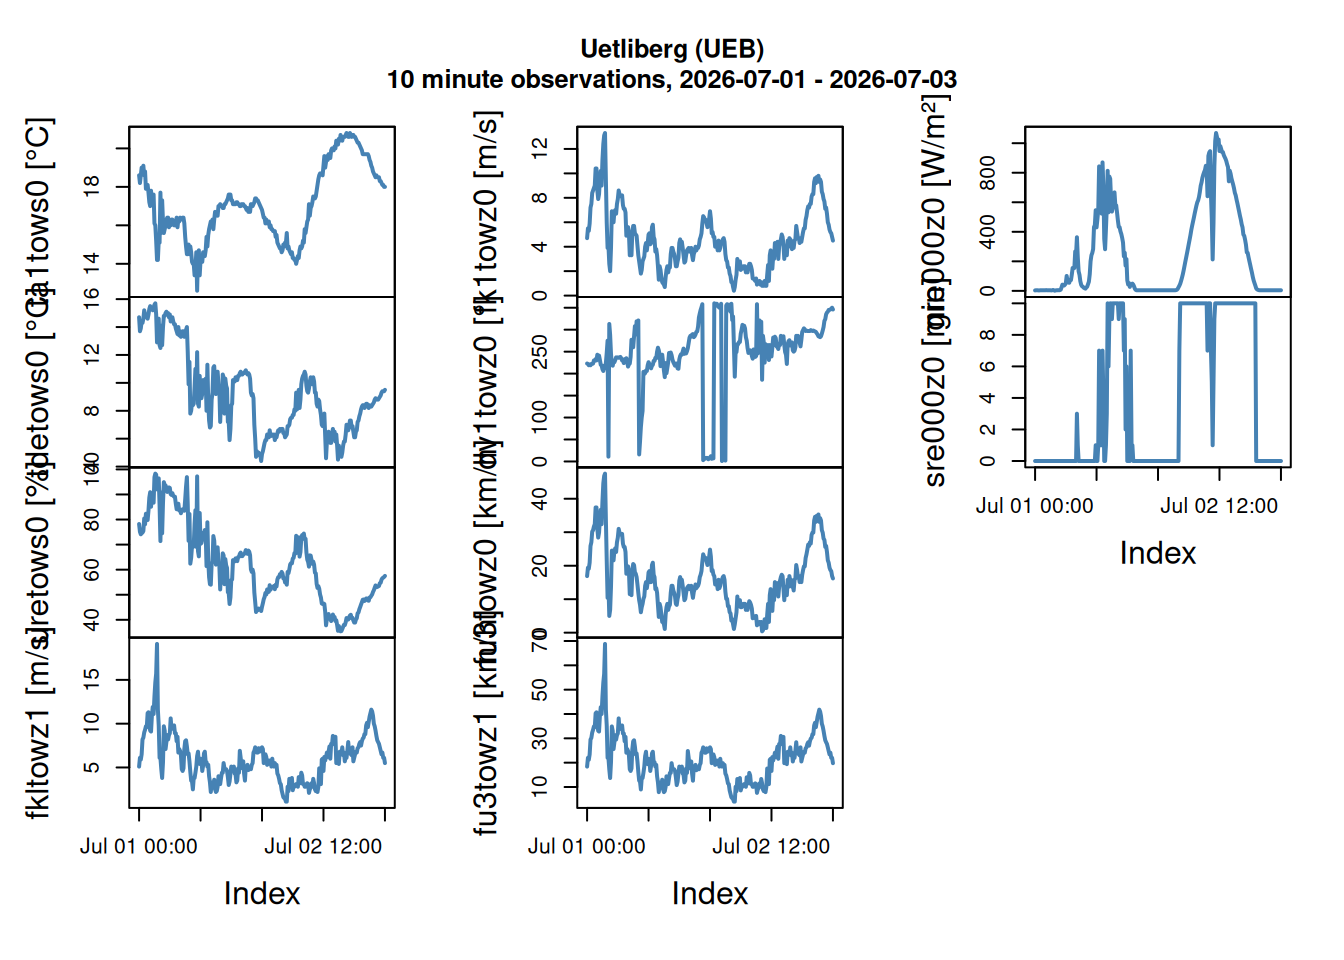
tower <- ms_stationdata(id         = "ch.meteoschweiz.ogd-smn-tower",
                        stations   = "UEB",
                        resolution = "t",
                        start      = "2026-07-01",
                        end        = "2026-07-03",
                        language   = "de")

head(tower)
ta1tows0 tdetows0 uretows0 fkltowz1 fk1towz0 dv1towz0
2026-07-01 00:00:00 18.6 14.7 78.2 5.1 4.7 223
2026-07-01 00:10:00 18.2 13.7 75.1 6.1 5.5 222
2026-07-01 00:20:00 18.6 13.9 74.1 5.9 5.3 219
2026-07-01 00:30:00 19.0 14.4 74.5 6.5 5.9 221
2026-07-01 00:40:00 18.9 14.3 74.8 8.2 7.2 219
2026-07-01 00:50:00 19.1 14.6 75.4 8.4 7.5 222
fu3towz0 fu3towz1 gre000z0 sre000z0
2026-07-01 00:00:00 16.9 18.4 3 0
2026-07-01 00:10:00 19.4 22.0 4 0
2026-07-01 00:20:00 19.1 21.2 4 0
2026-07-01 00:30:00 20.9 23.4 4 0
2026-07-01 00:40:00 25.9 29.5 3 0
2026-07-01 00:50:00 27.0 30.2 3 0# A tibble: 10 × 2
parameter_shortname parameter_description_de
<chr> <chr>
1 dv1towz0 Windrichtung vektoriell Turm; Zehnminutenmittel
2 fk1towz0 Windgeschwindigkeit skalar Turm; Zehnminutenmittel in m/s
3 fkltowz1 Böenspitze (Sekundenböe) Turm; Maximum in m/s
4 fu3towz0 Windgeschwindigkeit skalar Turm; Zehnminutenmittel in km…
5 fu3towz1 Böenspitze (Sekundenböe) Turm; Maximum in km/h
6 gre000z0 Globalstrahlung; Zehnminutenmittel
7 sre000z0 Sonnenscheindauer; Zehnminutensumme
8 ta1tows0 Lufttemperatur Turm; Momentanwert
9 tdetows0 Taupunkt Turm; Momentanwert
10 uretows0 Relative Luftfeuchtigkeit Turm; Momentanwert plot(tower, col = "steelblue", lwd = 2, nc = 3)